Unemployment Still Soars in Nevada, Recedes in North Dakota
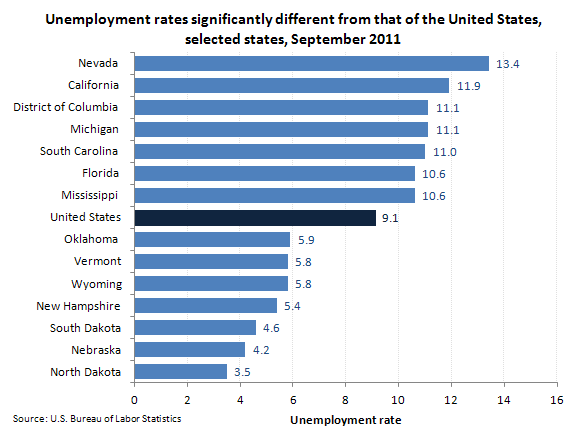
The national unemployment rate (at 9.1 percent) doesn’t always give a good picture of the employment highs and lows that individual states are experiencing. Many states have unemployment rates significantly different from the national average – either much higher or lower. The graph below looks at the states with the highest and lowest unemployment rates, with the U.S. national average highlighted in dark blue for comparison:

On the other end of the spectrum, a number of states are currently witnessing a modest resurgence in job opportunities, with comparatively low unemployment rates seen in New Hampshire (at 4.5 percent), and a number of states in the northern mid-west, including South Dakota with a manageable 4.6 percent, Nebraska with 4.2 percent and North Dakota with a favorable 4.2 percent.
“In total, 26 states reported jobless rates significantly lower than the U.S. figure of 9.1 percent, 10 states and the District of Columbia had measurably higher rates, and 14 states had rates that were not appreciably different from that of the nation,” The B.L.S. confirmed.
The B.L.S. also noted: “…from September 2010 to September 2011—28 states experienced statistically significant changes in employment, 27 of which were increases. The largest increase occurred in California (+250,700), followed by Texas (+248,500), New York (+98,100), and Florida (+93,500). The only state with an over-the-year statistically significant decrease in employment was Delaware (?6,100).”

